Quick Guide
The full documentation can be found at https://ncas-energy-balance-1-software.readthedocs.io/en/latest/
This repository contains scripts for logging data from an NCAS AMOF energy balance via an Campbell Scientific CR3000 logger using python.
The logger should be configured to generate data tables for the data it collects.
Information about getting started with the logger can be found on the Campbell Scientific website (https://www.campbellsci.co.uk/cr3000). See in particular the ‘Getting Started Guide’ and the Videos & Tutorials.
The names of these data tables will be required to use this software and get the data from the logger.
This software replaces the need to use Microsoft Windows software for acquiring the data.
Before attempting to install this software, ensure you have Python 3.7 and git installed. (What is Git: https://github.com/git-guides/) (Installing Git: https://github.com/git-guides/install-git )
The software is intended to be used for soil and radiation data products, and where data is referred to, it is data relating to these data products. It may also work with with CR1000 or other Campbell loggers but this has not been tested.
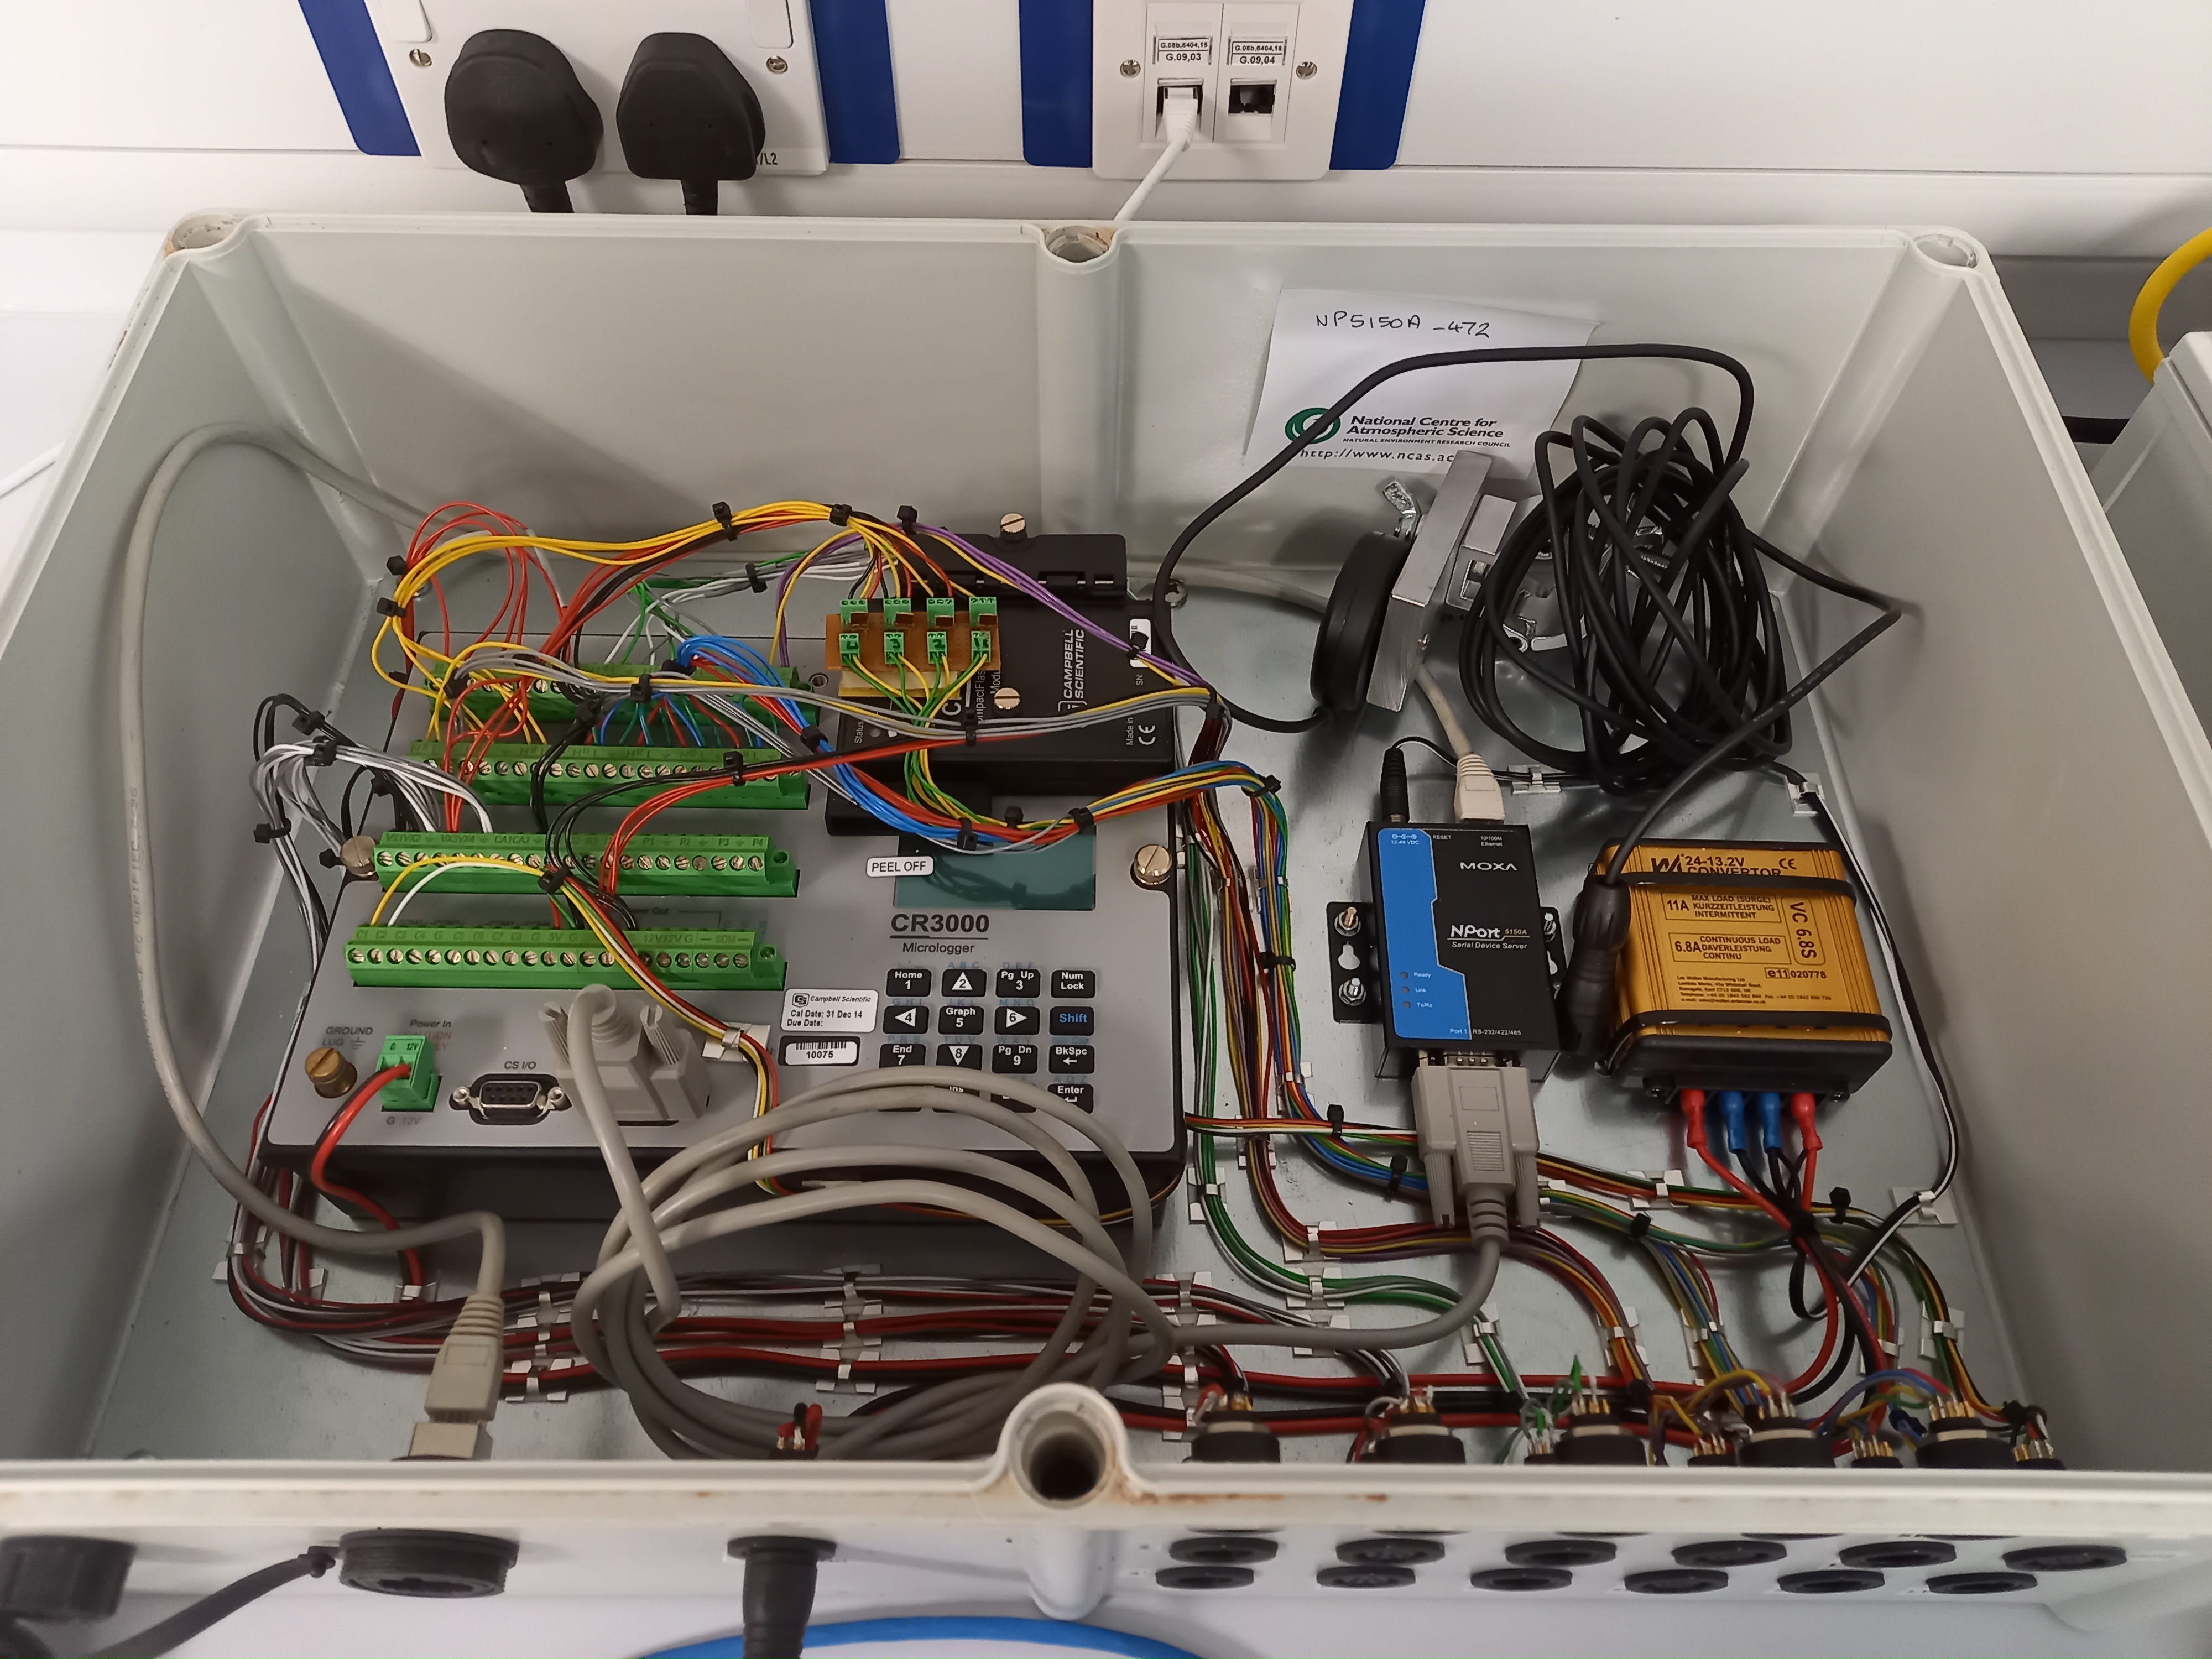
The CR3000 logger:
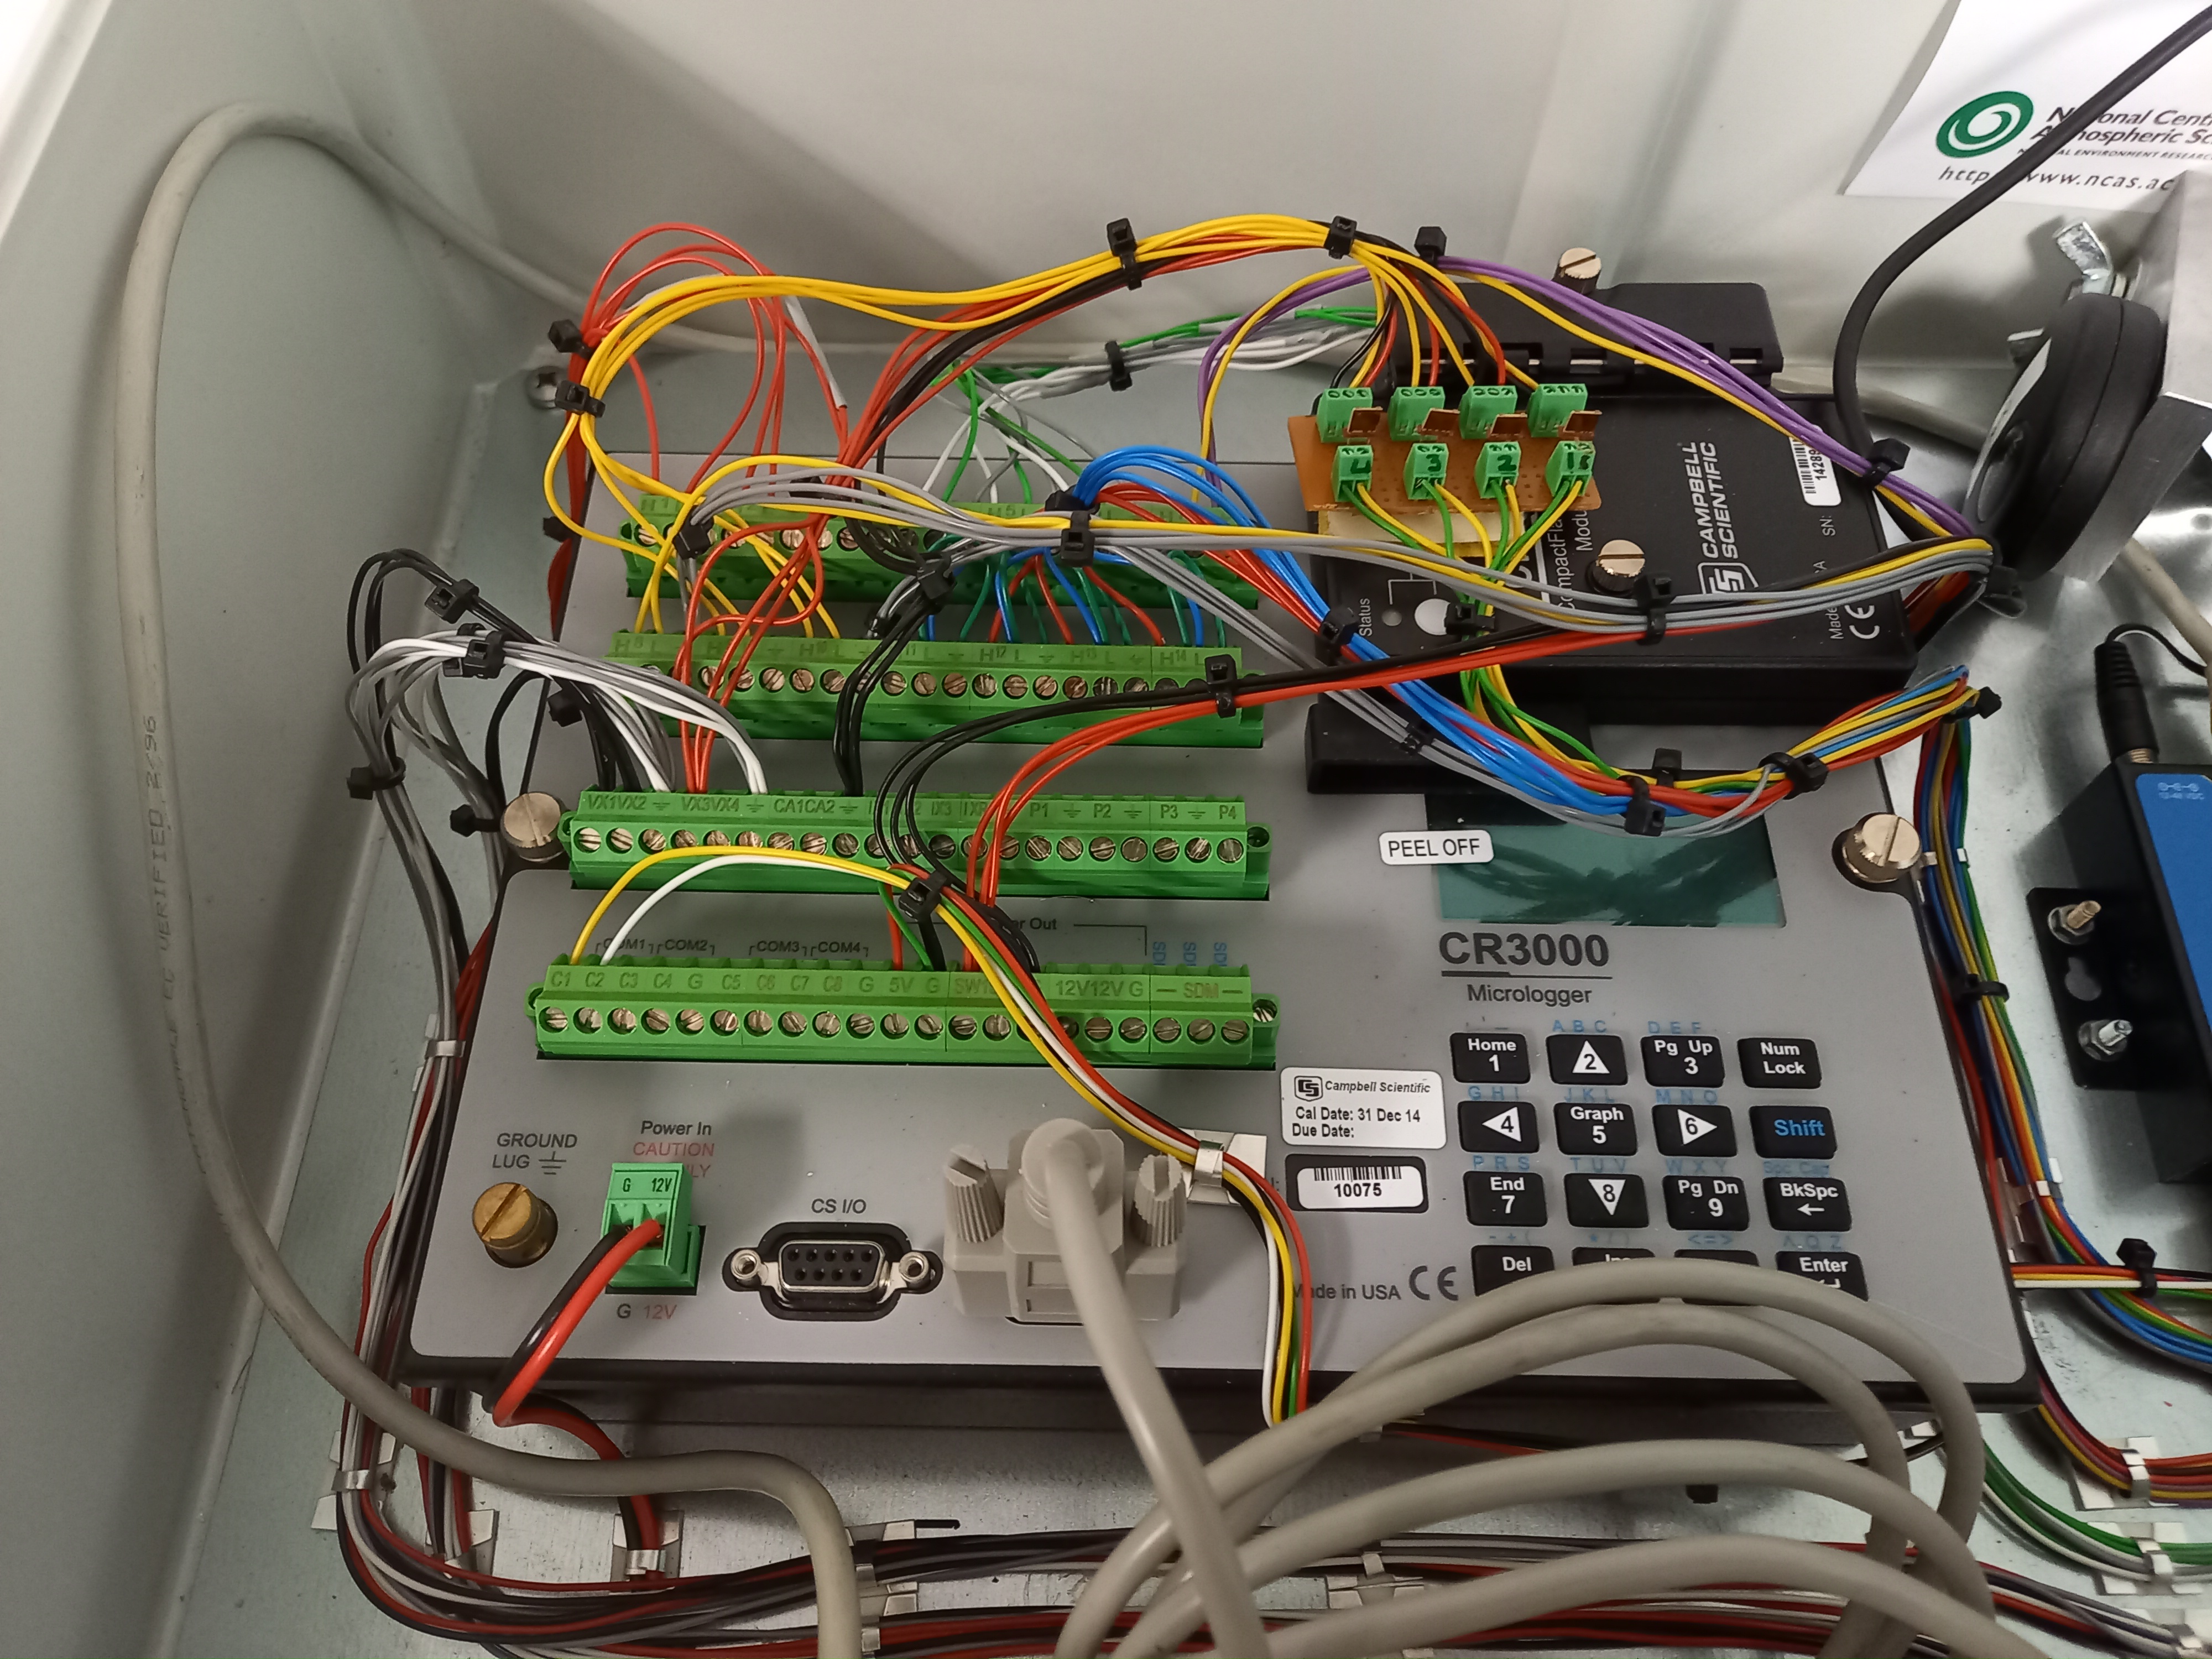
There are various components as explained briefly below:
The software provides capabilities for streaming data from the Campbell logger, downloading data from specific dates and producing a csv file containing this data for each day.
There is functionality to put the data from these daily csv files into a MySQL database, to allow for visualization e.g. with Grafana.
There is a script to create daily or monthly netCDF files that conform to the NCAS-GENERAL Data Standard from these daily csv files. As part of this process quality control is carried out on the variables, and quality control variables are added to the netCDF datasets.
It is also possible to create csv files for soil and radiation that have had quality control applied, to allow you to view the data manually or plot via the plotting script provided.
A plotting script is provided to plot specified csv columns against time, provided a timestamp exists in the csv file.
With this software the process of collecting data, applying quality control, plotting and creating netCDF files should be much more straightforward.
To see which scripts are available and what they do, go to scripts.
Install
All scripts can be downloaded from the Github repo.
In order to do this, follow the steps below.
An explanation of using git clone can be found here: https://github.com/git-guides/git-clone
$ git clone https://github.com/ncasuk/ncas-energy-balance-1-software.git
$ cd ncas-energy-balance-1-software
In order to use the scripts, create a virtual environment and install the package within the ncas-energy-balance-1-software repository:
The package is called energy_balance and contains the scripts and all you will need to use them.
$ python3 -m venv venv
$ source venv/bin/activate
$ pip install .
If you would like to be able to edit the scripts, change the final line to
$ pip install -e .
Creating a virtual environment allows you to manage the installation requirements. You will need to activate the virtual environment before using the scripts (source venv/bin/activate) after opening a new terminal window.
If running script 7 - plot_csv.py, you will need to install matplotlib. On Raspberry Pi, run
$ sudo apt-get install python3-matplotlib
Otherwise,
$ pip install matplotlib
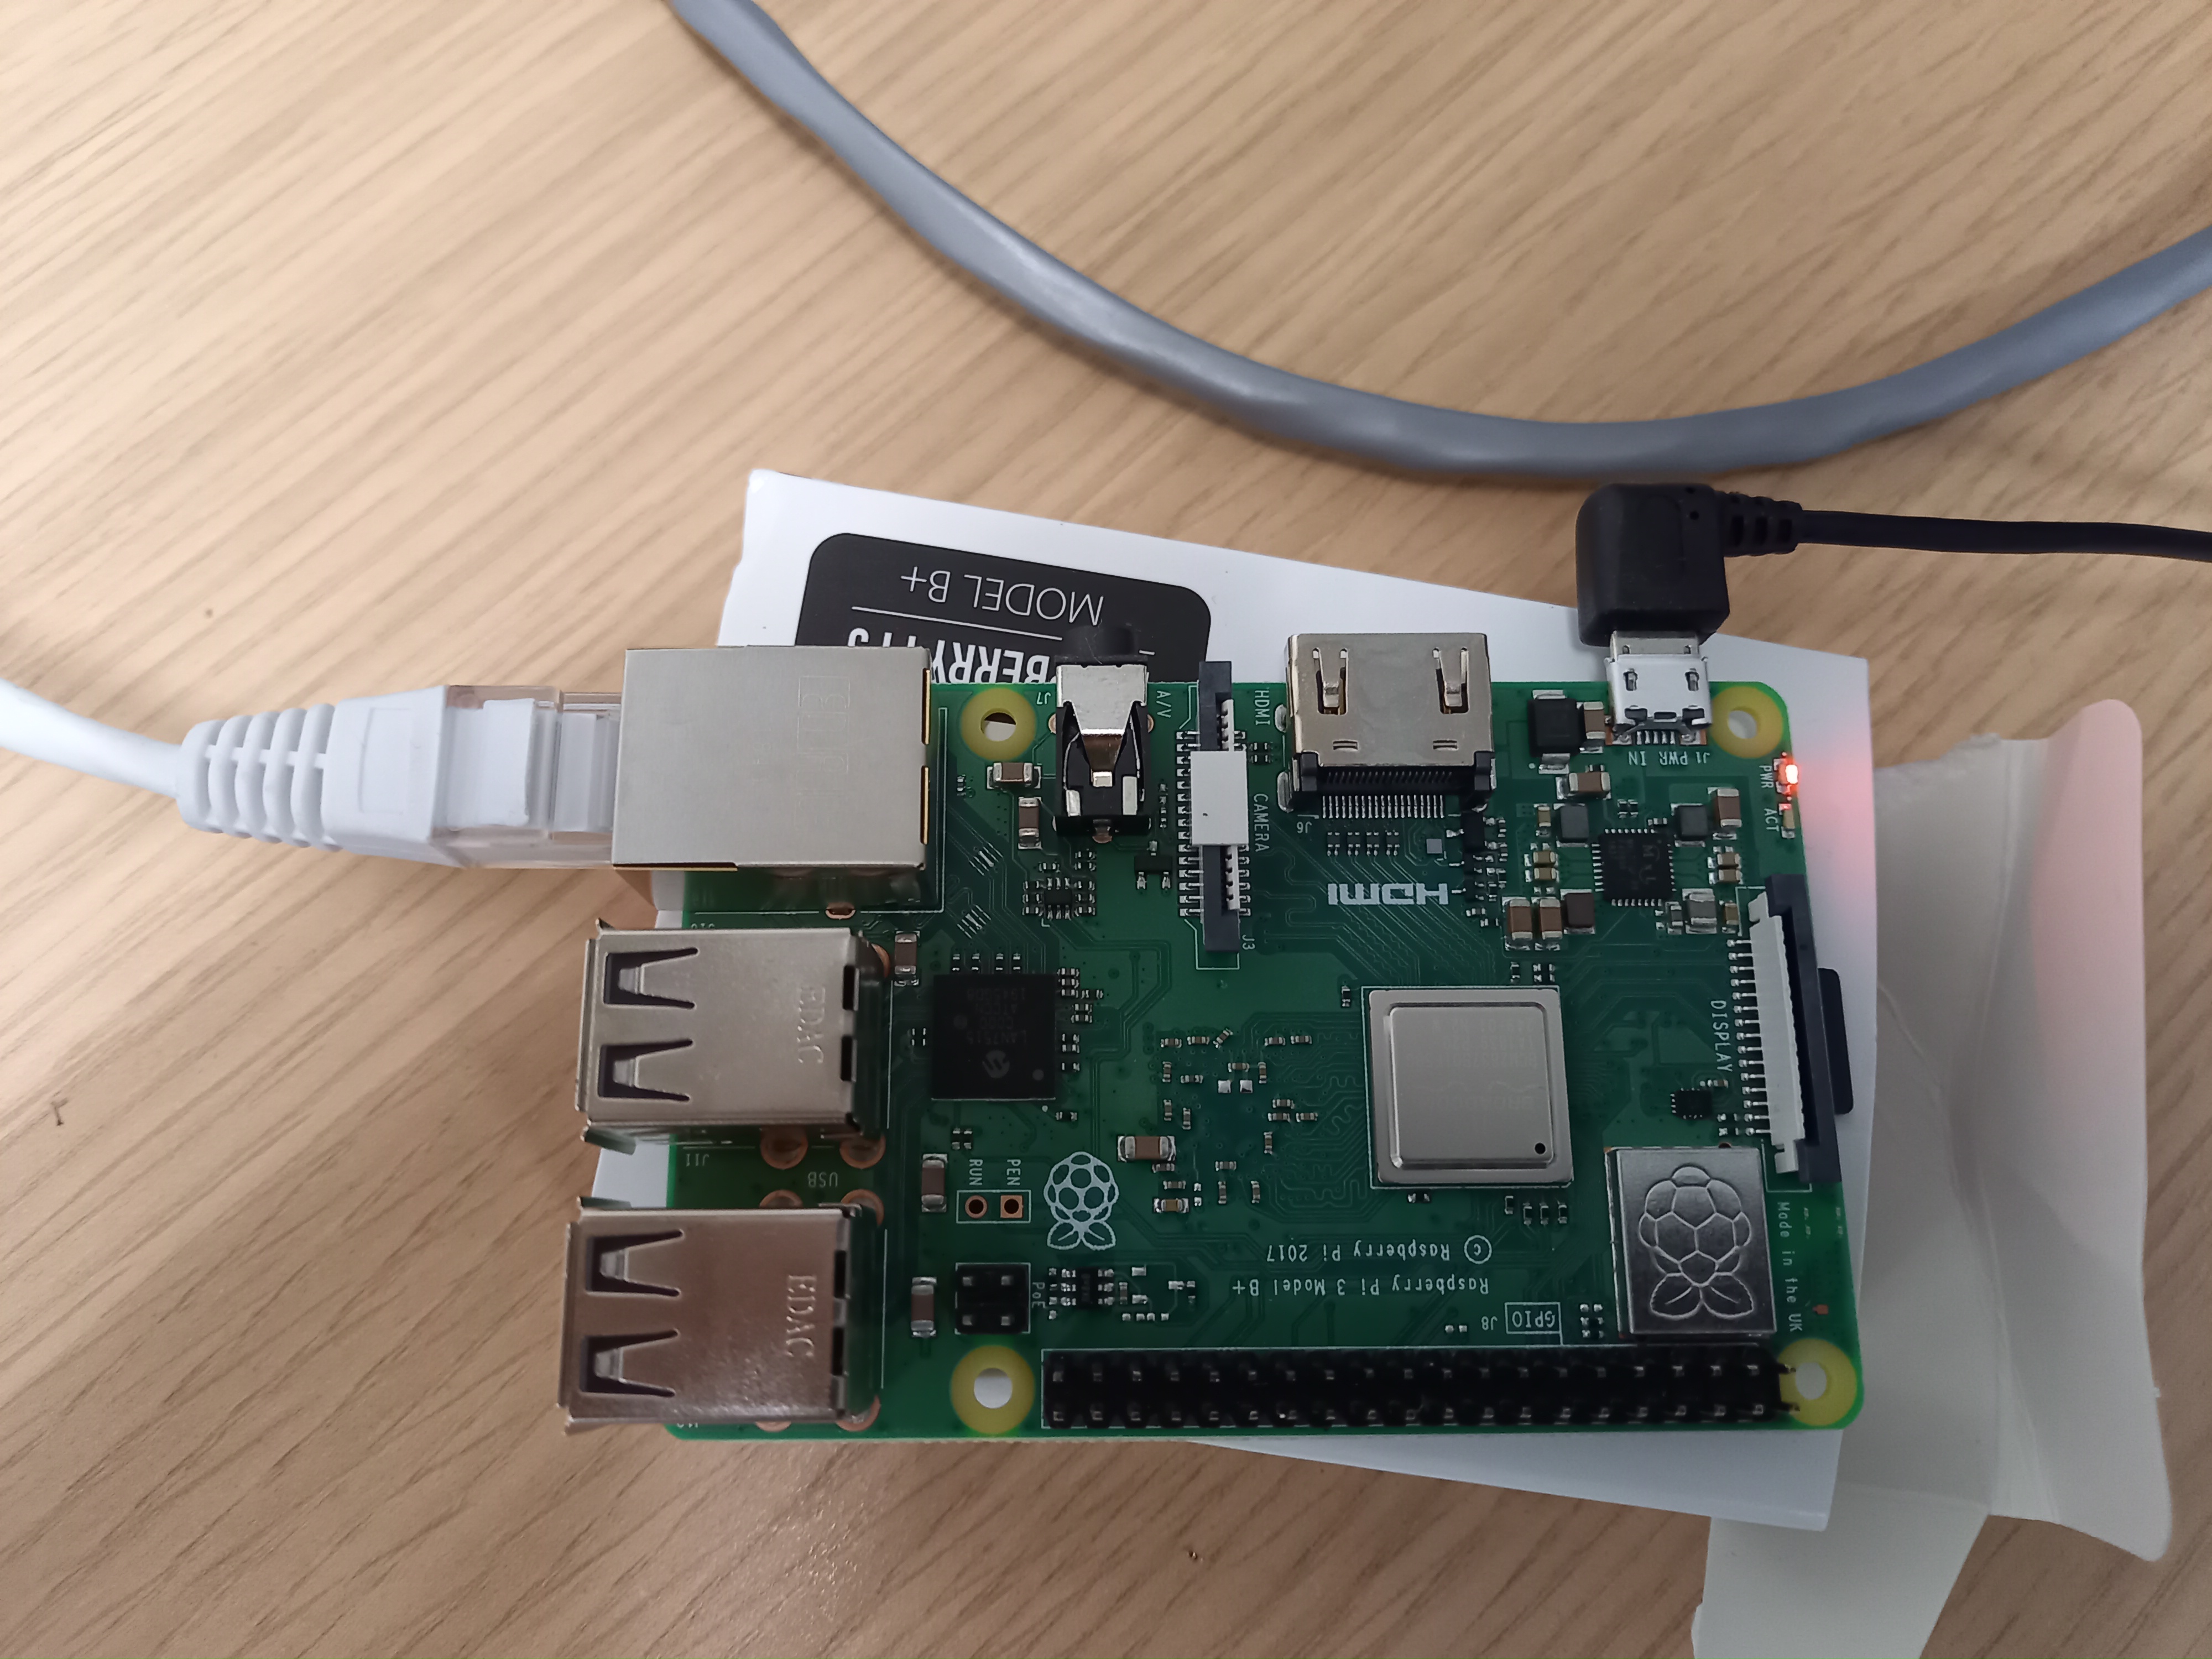
It is likely that you will use a Raspberry Pi to connect to the logger using a Moxa NPort in Real COM mode. Therefore you will run the scripts on the Raspberry Pi.
If using Real COM mode the Real COM driver must be installed (see https://www.moxa.com/en/products/industrial-edge-connectivity/serial-device-servers/general-device-servers/nport-5100-series#resources) along with raspberrypi-kernel-headers (run
sudo apt install raspberrypi-kernel-headers)You will then need to map the target IP to the Real COM port - find the readme explaining how to do this at the path:
/usr/lib/npreal2.You may then have to change the group and permission of the port:
$ sudo chown root:dialout /dev/ttyr0
$ sudo chmod 660 /dev/ttyr0
Sometimes there can be a problem installing numpy on Raspberry Pi. The troubleshooting page for this is: https://numpy.org/devdocs/user/troubleshooting-importerror.html
The command:
$ sudo apt-get install libatlas-base-dev
usually works.
If you get the error error: invalid command 'bdist_wheel', run the below command.
$ pip install wheel
You also may encounter problems installing netCDF4 on Raspberry Pi. The below steps should be used in the case where you get the error ValueError: did not find HDF5 headers.
$ sudo apt-get install libhdf5-dev
$ sudo apt-get install libnetcdf-dev
Below, images of the logger set up with a Moxa Nport and the Raspberry Pi.
Downloading Data
To start downloading data from the logger, ensure you have activated your virtual environment and set up any config changes (see what to change and how: config).
It is likely you will need to change logger_url, logger_csv_path and logger_tables in your config to get started.
You can either download data from a specific date range:
$ cd energy_balance/scripts
$ python download_data_by_date.py -s 2021-07-21 -e 2021-07-23
Or download all data from today:
$ cd energy_balance/scripts
$ python download_data.py
These commands will pull data from the tables you have specified from your logger and save it in csv files at the path you have provided.
Errors
Sometimes the scripts that retrieve data from the logger may raise an error such as:
NoDeviceException
If this occurs, please run the script again. The connection to the logger sometimes fails if there are too many queries sent.